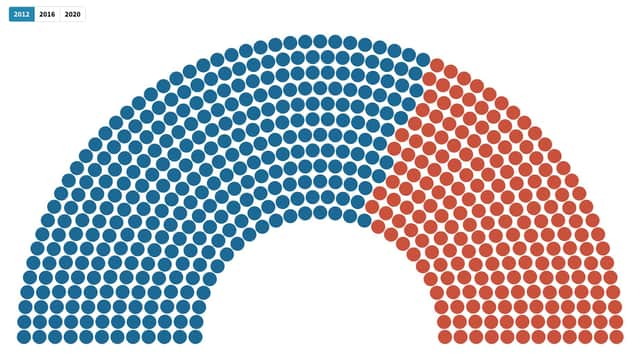
A brief guide to using our Electoral College votes graphic


While it is likely that popular vote counts could stretch out over the rest of this week and beyond, the Electoral College is perhaps where the real race for presidential victory lies.
President Trump famously won the 2016 Presidential Election with a majority of 77 votes in the Electoral College despite losing the popular vote against Hillary Clinton. Another notorious example of this happening was in the 2000 Presidential Election, where George W. Bush beat Al Gore on a slim majority of 5 electoral votes while losing the popular vote.
Advertisement
Hide AdAdvertisement
Hide AdOut of the total 538 votes available, a winning candidate must achieve a minimum of 270 votes – which are distributed according to a candidate’s popular vote share in each state.
Our map shows the shift in electoral votes between 2012, when incumbent President Obama led the college with a majority of 126 seats, to 2016 when President Trump won with 304 votes to Clinton’s 227.
As results in the Electoral College – with the exception of Maine and Nebraska who distribute their electoral votes proportionally – operate on a winner-takes-all basis, we will update the map’s 2020 tab to tally the share of seats going to each candidate.
This will help to give a clearer view of which candidate is more likely to achieve a majority of electoral votes, so do keep an eye on the graphic to see who emerges as the more likely winner of the Electoral College