These constituencies have seen the greatest increases in child poverty levels over the last four years, according to analysis by End Child Poverty. Children are classified as being in poverty if they live in a household with a total income of less than 60 per cent of median income, after housing costs.
These are the 10 UK areas where the rate of child poverty has risen most significantly.

. HARTLEPOOL, ENGLAND - SEPTEMBER 04: Children play on the streets of the Headlands area of Hartlepool on September 4, 2017 in Hartlepool, England. Hartlepool in the North East of England is one of the many coastal towns lagging behind inland areas with some of the worst levels of economic and social deprivation in the country. The Social Market Foundation (SMF) found that 85% of Great Britain's 98 coastal local authorities had pay levels below the national average for 2016. The government has announced that it will give 40 million GBP to encourage tourism and boost employment in the areas. (Photo by Christopher Furlong/Getty Images)
These are the UK areas where child poverty has risen the most (Photo by Christopher Furlong/Getty Images) Photo: (Photo by Christopher Furlong/Getty Images)

. Middlesbrough - 47.2% child poverty - up 16%
Middlesbrough has seen the highest rise in child poverty in recent years, with a rise of 16 per cent, meaning just less than half of all children in the constituency live in poverty, up from less than one in three in 2014/2015 (Photo: Geograph: Malc McDonald) Photo: (Photo: Geograph: Malc McDonald)

. Newcastle Upon Tyne Central - 45.2% child poverty - up 13.5%
With Newcastle Upon Tyne Central coming in just below Middlesbrough with the second highest rise in child poverty, it’s clear that the North East is seeing major issues. This constituency has seen a 13.5 per cent rise since 2014/2015 (Photo: Shutterstock) Photo: (Photo: Shutterstock)

. Birmingham Hodge Hill - 53.8% child poverty - up 13.4%
One of three Birmingham constituencies to feature on the list, more than half the children in Birmingham Hodge Hill live in poverty, up 13.4 per cent in the last few years (Photo: Geograph: Richard Law) Photo: (Photo: Geograph: Richard Law)

5. Birmingham Ladywood - 54.5% child poverty - up 12.7%
Birmingham Ladywood has the highest child poverty rate on the list, after a 12.7 per cent rise since 2014/2015 (Photo: Shutterstock) Photo: (Photo: Shutterstock)

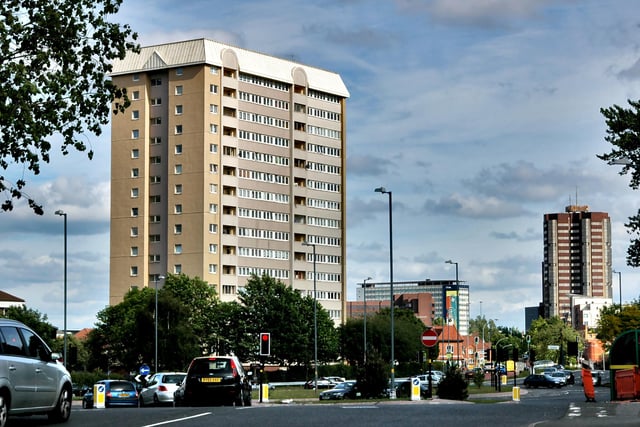
6. Birmingham Yardley - 44.7% child poverty - up 12.4%
With 44.7 percent of children in Birmingham Yardley growing up in poverty, the constituency has the lowest rate in the city, but is still well above the national average after a rise of 12.4 per cent in the last few years (Photo: Flickr: Tim Ellis) Photo: (Photo: Flickr: Tim Ellis)

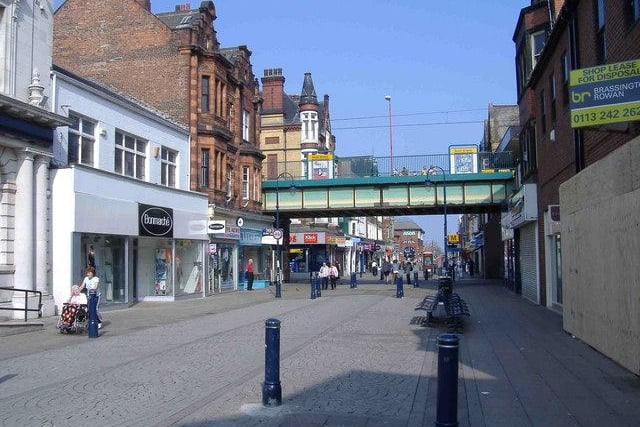
7. South Shields 39.3% child poverty - up 11.1%
Another North-east constituency which struggles with child poverty is South Shields, where more than one in three children now grow up in poverty following an 11.1 per cent rise since 2014/2015 (Photo: Geograph: Roger Cornfoot) Photo: Photo: Geograph: Roger Cornfoot

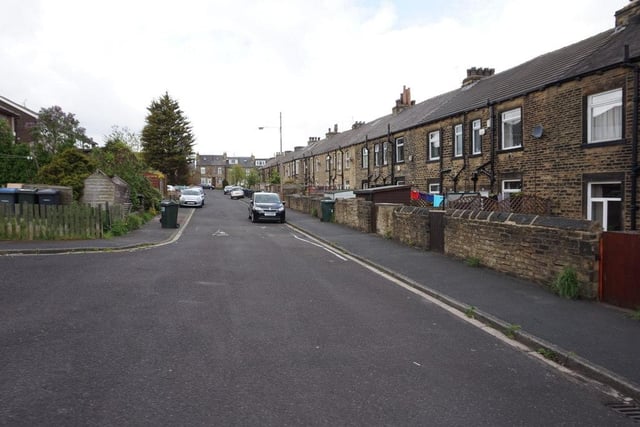
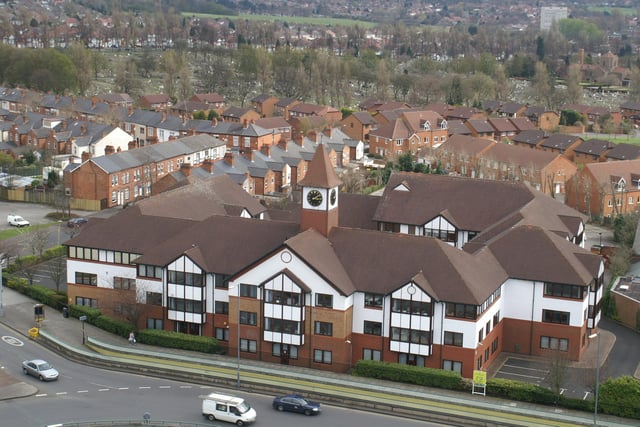
8. Bradford East - 46.9% child poverty - up 10.5%
Both Bradford constituencies have a clear issue with child poverty, though Bradford East has seen a slightly less dramatic increase since 2014/2015 (Photo: Geograph: Ian S) Photo: (Photo: Geograph: Ian S)