Climate change: How Scottish technology is working with space agencies to take viewers from Antarctica's frozen landscapes to subglacial lakes
Picture the rugged frozen landscapes of Antarctica, the world’s most southerly and most remote continent. It’s a beautiful, but inhospitable place, with the strongest winds on earth and temperatures which can plunge below –80C.
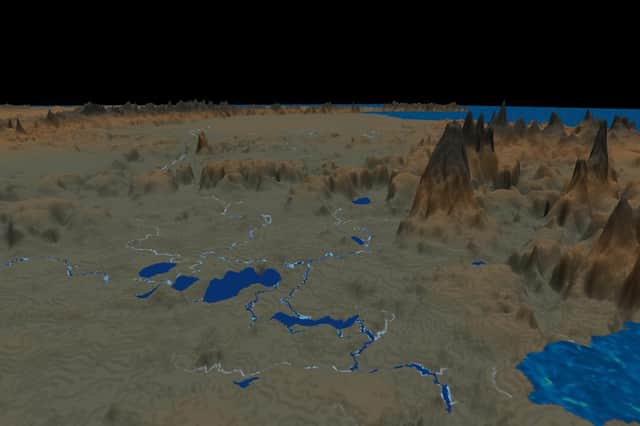
Now imagine if you could see at a glance how air, water and glaciers interact there and how rising temperatures have been affecting the environment over the past decade.
Well you can.
Advertisement
Hide AdAdvertisement
Hide AdWhat’s more, you can even take an underwater journey to see what’s going on under the ice and how ocean currents are influenced by the movement of meltwater and subglacial lakes.
This is all possible thanks to innovative work by a Scottish tech start-up, which has been collaborating with the European Space Agency (ESA) and Nasa to create user-friendly 3D and 4D data visualisation tools.
The team at Earthwave, which is based in Edinburgh, uses information gathered by satellites to provide cutting-edge immersive and interactive animations that allow viewers to see for themselves how the world is changing.
The company was set up by chief executive Martin Ewart and co-founders Livia Jakob, chief scientific officer, and scientific director Dr Noel Gourmelen.
Mr Ewart, a mathematician and keen gamer, had worked in the business sector building analytics systems for companies such as Amazon and Barclays. But he “wanted to do something more impactful”, so signed up to undertake a masters degree in earth observation at the University of Edinburgh.
Through his studies he was inspired to set up Earthwave, with a mission to “operationalise science”.
The father-of-two says he believes people are interested in science and open to deeper engagement – an idea well illustrated during the height of the Covid pandemic, he points out, when health experts bombarded the public with statistics and quickly changing rules on a daily basis.
And graphic presentations can more effectively explain complicated information and better engage audiences, he maintains.

Advertisement
Hide AdAdvertisement
Hide AdMr Ewart says satellite photography of Ukraine released in the run-up to and after Russia’s invasion of the country showed forces amassing and damage inflicted after the invasion, providing a detailed picture of the progress of the conflict.
“We saw lots of images from Ukraine,” he said. “It made what was happening there obvious to the general public like never before. We could see it in real time.
“That’s just one example of how people can be made aware of things that are happening across the world.”
Earthwave’s new tool, named VISOR, sprung out of a project – Digital Twin Antarctica – commissioned by the ESA to advance understanding of the behaviour of polar ice sheets and their impacts on other systems.
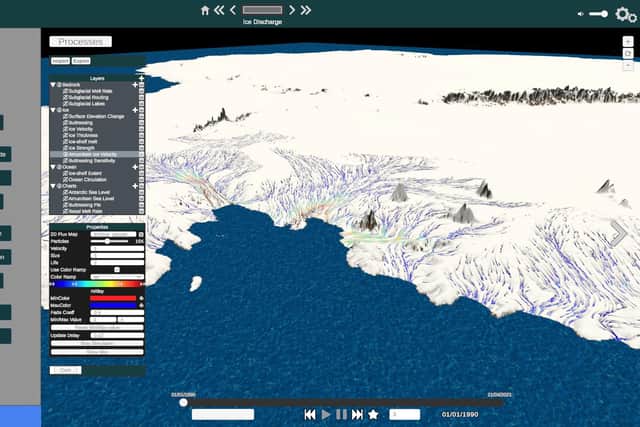
The challenge for the team was how to display all the processes that were taking place simultaneously in the area in a way that would be easy for scientists, decision-makers and ordinary people to quickly and easily comprehend.
“For my own personal ambition, I love the fact that you can do something in an engaging way, particularly engaging teenagers and giving people that understanding about changes that are happening on the earth,” he said.
“We are facing increasing challenges in the world, and if you can just show people in an unbiased way what is happening and if people can understand what is taking place, then it helps the conversation all round.”
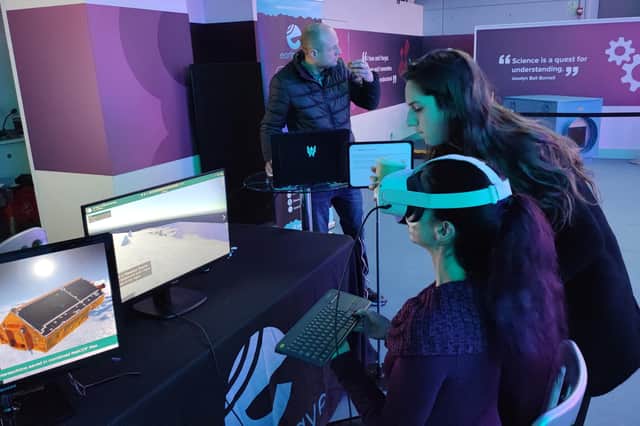
Based on the Unity gaming engine, VISOR uses virtual reality to bring the data to life. Several ‘layers’ of measurements are incorporated, allowing users to watch a general overview of changes that are happening around the Thwaites glacier, nicknamed the Doomsday glacier, or select specific datasets to focus on particular impacts.
Advertisement
Hide AdAdvertisement
Hide AdAndrea Incatasciato, earth observation data scientist with Earthwave, is project leader for VISOR. “Most people are curious, especially when they see this kind of thing,” he said.
“Visualisation helps your curiosity. It would be nice to use your curiosity to learn about things like climate change, to help you really understand how this is impacting our lives.”
And it’s not just Antarctic warming that can be visualised – the concept lends itself to an almost limitless number of applications, according to Mr Ewart.
Models could be created for all sort of audiences and sectors – some potential uses could be to demonstrate population changes on a local or global level; to map out climate-related risk factors such as flooding or coastal erosion for insurance purposes; plotting the carbon-sequestration capacity of different landscapes; the availability of water in different regions; demonstrating renewable energy production; or even charting the performance of commodity prices.
“If there is data with a location and a time, we can create a visualisation,” he said.
He thinks Earthwave’s technology has a big future and multiple uses, with scope to create products for innovative companies, journalists, academics and educators to use in their work.
The Earthwave team is already beavering away on plans to set up state-of-the-art pods that could be installed in museums and science hubs, giving visitors a fully immersive, multi-player experience using virtual reality and gaming technology.
Demonstrations of VISOR at the Glasgow Science Centre were “well-received”. Discussions have been held with Edinburgh's Dynamic Earth and the science centres in Glasgow and Aberdeen.
Advertisement
Hide AdAdvertisement
Hide AdAnd Scotland is a great place to be for a start-up involved in big data, given the burgeoning space industry.
The country has some of the highest space-related activity in Europe, with Glasgow manufacturing more satellites than anywhere else in the region and a number of spaceports and launchpads currently in development.
“Scotland is punching above its weight in the space sector, it is really representing itself,” Mr Ewart said. “Now we need the tools to communicate the information being gathered.
“There is lots of expert analysis looking at earth observation data, but this is still largely dominated by the military, academics and governments. There is huge scope for use in the commercial sector and that area is rapidly expanding.”
Comments
Want to join the conversation? Please or to comment on this article.