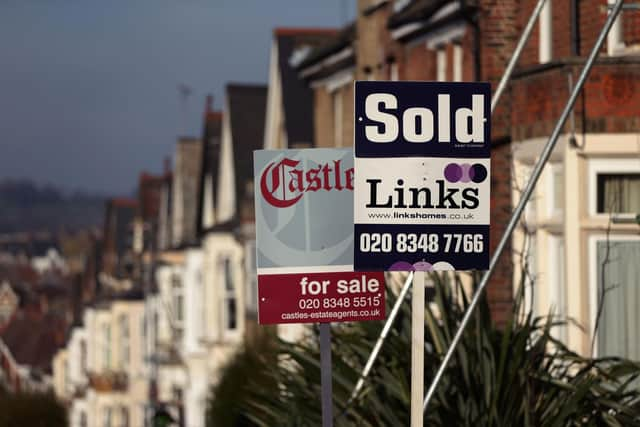
Nationwide Building Society figures show that average first-time buyer home costs five-and-a-half-times typical annual earnings
As house prices have surged, the average first-time buyer house price-to-gross earnings ratio in the third quarter of this year was 5.5, surpassing a previous high of 5.4 in 2007.
The figures were compiled by Nationwide Building Society, which said a 20% deposit on a home now equates to 110% of the pre-tax income of a typical full-time employee - which is also a record high and up from 102% a year ago.
Advertisement
Hide AdAdvertisement
Hide AdAndrew Harvey, senior economist at Nationwide, said: "In the third quarter of this year, the UK first-time buyer house price-to-earnings ratio stood at 5.5, above the previous high of 5.4 in 2007, and well above the long-run average of 3.8.


"While there continues to be a significant gap between the least affordable and most affordable regions across the UK, this has remained broadly stable over the last year.
"London continues to have the highest house price to earnings ratio at 9.0, although this is still below its record high of 10.2 in 2016.
"Scotland continues to have the lowest house price to earnings ratio in the country at 3.4, closely followed by the North (of England) region at 3.5."
Many first-time buyers are relying on financial support from family members to help them make the move.
Here are average first-time buyer house price-to-earnings ratios in the third quarter of 2021, according to Nationwide Building Society:
- North of England, 3.5
- Yorkshire and the Humber, 4.0
- North West, 4.2
- East Midlands, 5.0
- West Midlands, 5.0
- East Anglia, 5.6
- London, 9.0
- South West, 6.4
- Wales, 4.6
- Scotland, 3.4
- Northern Ireland, 4.5
- Outer South East (includes Ashford, Basingstoke and Deane, Bedford, Braintree, Brighton and Hove, Canterbury, Colchester, Dover, Hastings, Lewes, Fareham, Isle of Wight, Maldon, Milton Keynes, New Forest, Oxford, Portsmouth, Southampton, Swale, Tendring, Thanet, Uttlesford, Winchester, Worthing), 6.5
- Outer Metropolitan (includes St Albans, Stevenage, Watford, Luton, Maidstone, Reading, Rochford, Rushmoor, Sevenoaks, Slough, Southend-on-Sea, Elmbridge, Epsom and Ewell, Guildford, Mole Valley, Reigate and Banstead, Runnymede, Spelthorne, Waverley, Woking, Tunbridge Wells, Windsor and Maidenhead, Wokingham), 7.2
