How house prices have changed where you live in Scotland
The average house price in Scotland increased by 6.2% annually to £144,377, according to the latest data from the Office for National Statistics.
That compares to a UK average of £225,047 (an increase of 4.4%) and £242,176 in England (up 4.1% ).
Advertisement
Hide AdAdvertisement
Hide AdEdinburgh continues to be one of the main drivers for this increase. The average cost of property in the capital is now £250,986, up 11.2% year-on-year.

Graphic: ONS
Glasgow saw a rise of 7.7% to £126,216, while Aberdeen continued to experience a decline in the average house price, down 1.5% to £159,653.
However, it is the Orkney Islands which recorded the largest rise in the whole of the UK. The average price there is now £141,213, up 14.1% on the previous year.
That compares to a 13.8% slump to £154,785 for the Shetland Islands.
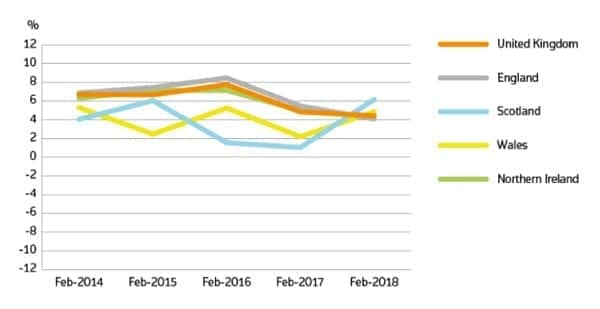
Annual price change for Scotland over the past 5 years:
Graphic: ONS
House prices by local authority (average price / annual change):
Aberdeenshire £191,954 / 2.80%Angus £145,285 / 4.80%Argyll and Bute £144,404 / 13.30%City of Aberdeen £159,653 / -1.50%City of Dundee £116,910 / 0.40%City of Edinburgh £250,986 / 11.20%City of Glasgow £126,216 / 7.70%Clackmannanshire £121,160 / 10.50%Dumfries and Galloway £124,828 / 4.60%East Ayrshire £95,189 / 7.10%East Dunbartonshire £204,659 / 4.00%East Lothian £213,712 / 10.80%East Renfrewshire £220,485 / 4.30%Falkirk £121,129 / 10.00%Fife £131,237 / 5.60%Highland £158,860 / 3.10%Inverclyde £98,581 / 2.50%Midlothian £168,009 / 6.80%Moray £147,675 / 5.40%Na h-Eileanan Siar £98,563 / -6.90%North Ayrshire £99,638 / 5.60%North Lanarkshire £103,085 / 6.40%Orkney Islands £141,213 / 14.10%Perth and Kinross £178,240 / 2.80%Renfrewshire £119,365 / 7.90%Scottish Borders £150,570 / 10.60%Shetland Islands £154,785 / -13.80%South Ayrshire £132,151 / 4.80%South Lanarkshire £126,850 / 6.90%Stirling £174,076 / -0.50%West Dunbartonshire £103,377 / 10.50%West Lothian £153,230 / 11.20%
Source: ONS