New maps reveal Scotland's forest fightback since 1930s


The comparison map tool from NLS reveals the fascinating development in the Scottish landscape during the 20th century, particularly due to widespread afforestation - the process of planting forests - and expanding towns and cities.
Users are even able to zoom in to a local level to view new reservoirs, new roads, and significant changes that have occured to their own areas.
Advertisement
Hide AdAdvertisement
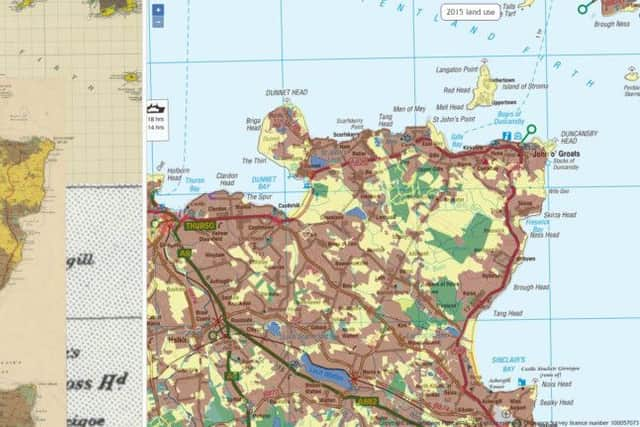
Hide AdDiscussing the map, NLS Map Curator, Chris Fleet said: “You can see at a glance the striking changes with woodland cover over the past 85 years.
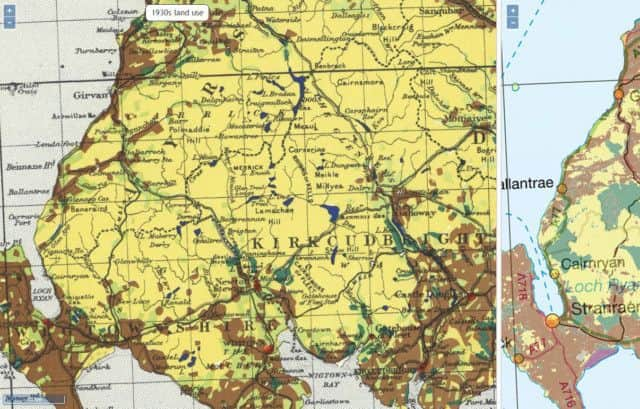
“There was actually relatively little woodland cover in the 1930s, and we can see that particularly in areas like Argyll & Bute and Dumfries & Galloway the planting of trees has led to a visible rise in woodland areas.
“Other changes that can be seen are the spread of urbanisation and road networks as well as the changing distribution of arable and pastoral farmland.”
At the conclusion of the Second World War, The Forestry commission made replanting a priority after much of Britain’s woodland had been felled to satisfy timber requirements of the two world wars.
This has led to both Scotland’s woodland and urban areas increasing in size over the time period.
Forestry is now an employment bedrock in areas like Dumfries and Galloway, with complex supply chains and well-paid jobs. The maps use the Land Utilisation Survey maps of the 1930s and compares them to the 2015 Historic Land-use Assessment (HLA Map) layer from Historic Environment Scotland (HES).
The interactive land use viewer can be viewed in full on the NLS website.